|
Decision Support System (DSS) Dashboard
Introduction The main issues: Searching the internet for Business Intelligence (BI) tools, there are big name vendors with brilliant webpages presenting great features and capabilities. This makes anyone wonder if CEO are buying what are posted on these webpages or the claims and the promises posted by these vendors. The main issues in building BI tools are the size and complexity of Big Data, the ever-changing markets and clients, social media impact on the clients, the ever-changing technologies, and the rest of the list is not small. This boils down to the following: Storing and handling Big Data Turning Big Data into manageable matrixes for faster and intelligent analysis Making sense of Big Data, CRM, Social Media and market-clients trends Build a GUI Decision Support System (DSS) Dashboard Use Case: Decision Support System (DSS) Dashboard Description: Intelligent Dashboards are the latest and the greatest tools used by CEO in making decisions, plans, strategies, budgets and reports. How can we architect an Intelligent Decision Support System (DSS) Dashboard for CEO which provides real answers not just brilliant webpages with claims and promises. Briefly Describe This Use Case Big Data (structured and unstructured) is still a puzzle and making sense of Big Data is the goal. Big Data need to be stored, summarized, processed, and analyzed. Data should be presented in an effective format, otherwise, it would not have any value. Our best answer is using matrixes and hash tables. The analogy of our approach is the use of Shorthand or Stenography which increases speed and briefness of writing as compared to longhand. With the same principle, tables and hash tables would be our short hand of values found in Big Data. In short, we would turn data into a tabular format. Tables are best suited for representing individual information and represent both quantitative and qualitative information. Hash Tables can be used as indexes to place holders of more data or processes. Primary Actor: CEO, stakeholders, directors and architects. Goals: Dashboard is mainly used as a management tool to gauge performance and progress toward business goals. Dashboards can be designed and developed to address a wide range of objectives, from monitoring the practicality of a global organization's business strategy to deliver a mix of operational, financial and project-specific information. We are taking dashboard to another intelligent, dynamic and real time level. We architecting dashboard with intelligent layers. Each layer is a service its successor. We also adding website builder features, where CEO and their supportive teams can build a running website with all the site gadgets and products details in real time with a push of a button. See our Spring Replacement (The Elephant in The Room) Page. Analysis Our analysis in a nutshell is how to shorthand values stored in Big Data into a number of manageable tables and hash tables for faster processes and analysis. These tables must be kept running in memory, updated on a regular basis and stored or backed up for reuse. We need to learn from that fact that Big Data size and complexity are manageable. Our architect would create a number services and each service has a limited number of matrixes and hash tables. We should make use of algorithms and abstract thinking in building the matrixes and the hash tables. Using Virtualization Objects: Virtualization means to create a virtual version of a device or resource, such as a server, storage device, network or even an operating system where the framework divides the resource into one or more execution. We are architecting virtual servers and virtual objects as well as virtual testing servers for testing these virtual objects. Architecting Intelligent Objects: How can we add Intelligent to Java Objects? We are implementing matrixes and bit maps for fast processing using numeric values. These processes include:
Architect Our Dashboard architect's main goal is to turn Big Data into data visualizing tool to help CEO compete in today's competitive market. Our architect is to shorthand values in big data into manageable data format. Then use this format in creating CEO Data Visualizer. We are also taking dashboard to another intelligent, dynamic and real time level. CEO and stakeholders and their supportive teams can actually build an entire website with all its gadgets and products details. We using Virtualization in the dashboard implementation. 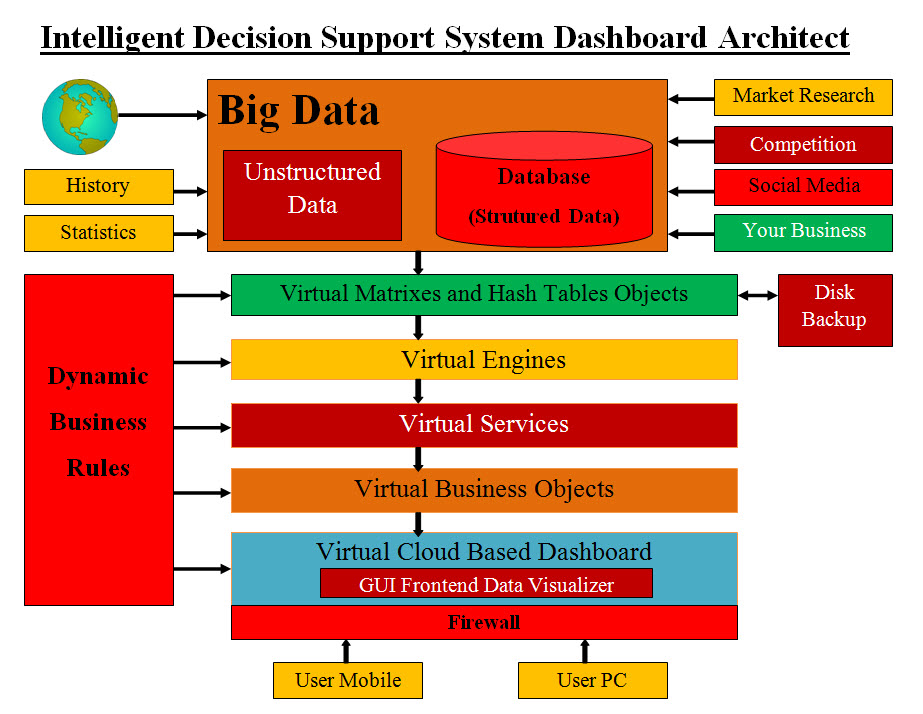
DSS Dashboard Diagram - Figure #1 DSS Dashboard Diagram (Figure #1) presents how data flow through the systems and types of processes and services are utilized to create an intelligent DSS Dashboard. Input of Big Data: Big Data is composed of Petabytes (1,024 terabytes) or exabytes (1,024 petabytes) of data which consists of billions to trillions of records of millions of people. Structured data is what databases are storing. Unstructured are files of different types of data such as XML, Excel sheets, PDF, images, text, video, audio, ..etc. The size and complexity of data is main issue. The following are some of Big Data input: 1. History 2. Market Research 3. Statistics 4. Competition 5. Social Media 6. Structured Data 7. Unstructured Data Virtual Matrixes and Hash tables: To shorthand values in Big Data, we are proposing the use of the following methodologies. First we need to group data values into target groups such as personal, business, type of business, transactional processes, statistics, ..etc. We can use abstract thinking in making decisions and predications. The data selected for these target groups would be stored in data table and hash tables. We are implementing hash tables as lookup values which may not be numeric. These data tables and hash tables would be running as memory resident objects which can be stored or backed up. Virtualization is an added feature which helps in customization-building-deleting these objects. It can also clones-copies these objects with speed. The following are some of our approaches, methods and processes: 1. Algorithms 2. Abstract Thinking 3. Personal 4. Business 5. Big Business 6. Transactional Processes 7. Statistics Virtual Engines Objects: Once the target data object are created, then we need build what we call Engines. These engines use the target data objects to perform the dashboard detailed tasks or processes. Each engine performs only one task and no overlapping of tasks. These engines should be documented and tested. These engines are also virtual objects. They are loosely coupled and refactoring and transparency are also implemented. The following are engines tasks list: 1. Social Media 2. Marketing 3. Segmentation 4. Customization 5. Trends and tendencies 6. Forecasting 7. Promotion 8. Operation 9. Sales 10. Risks 11. Competition 12. Ad Hoc handling 13. Strategic Planning 14. Plans 15. Finance 16. Key Performance Indicators 17. Reports Virtual Services Objects: Service Objects would be using different engines objects to create independent services. These services objects would create loosely coupled services. Therefore the details of each services are performed by a number of engines. Overlapping of usage of engines would help eliminate duplication of development code and effort. The following are some of the virtual services objects: 1. Analytics 2. Marketing 3. Trends and tendencies 4. Forecasting 5. Promotion 6. Sales 7. Competition 8. Operations 9. Ad Hoc handling 10. Strategic Planning 11. Plans 12. Finance 13. Key Performance Indicators 14. Reports Virtual Business Objects: Business Objects are the cloud dashboard services handlers. They would create the services objects to handle the Virtual Cloud based Dashboard requests. They perform the management of services. Virtual Cloud based Dashboard: Virtual Cloud based Dashboard is the virtual web cloud server running on the web. It handle security using a number security components including firewalls. GUI Frontend Data Visualizer: GUI Frontend Data Visualizer is GUI frontend component which the end users would be using. Disk Backup: These can be implemented in a number of ways including Network-Attached Storage (NAS) or and Storage area networks (SANs) |
|---|